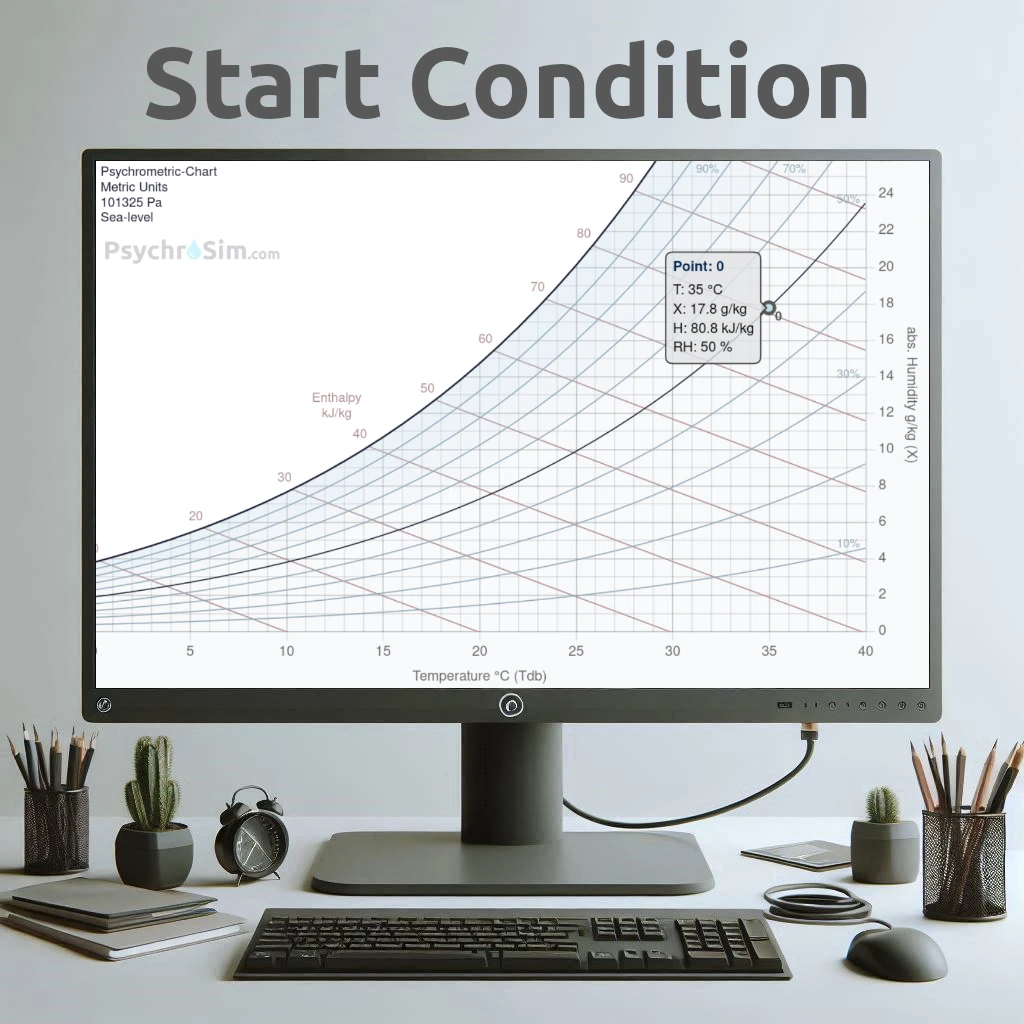
START    Mollier-Diagram


Meerdere Processen

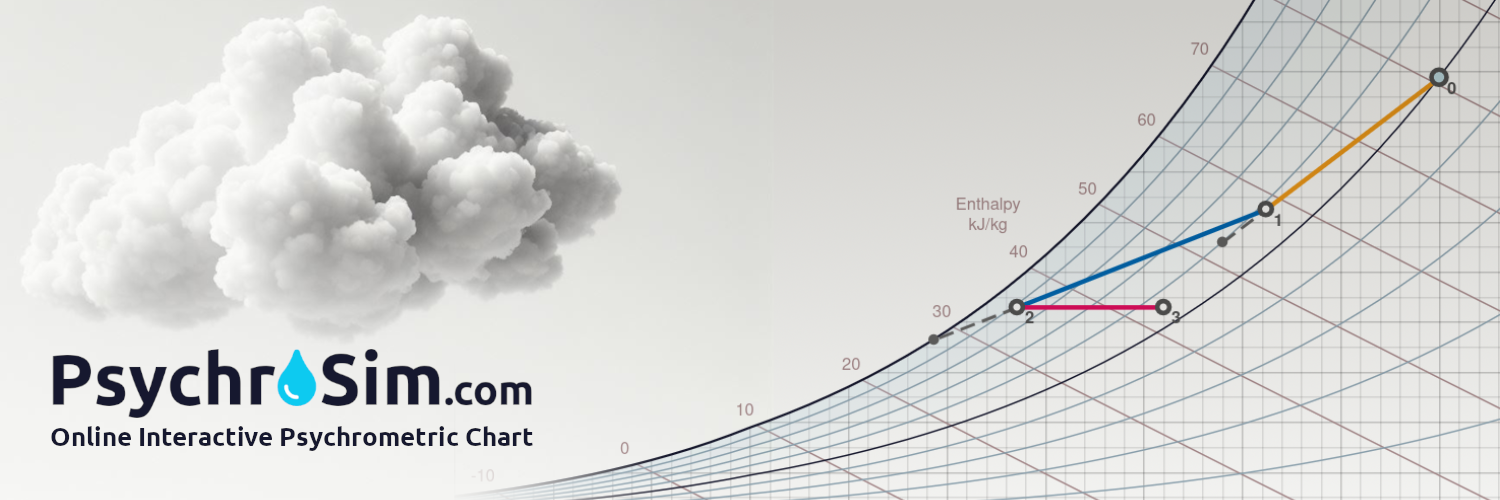
Met deze online tool kunt u thermodynamische processen simuleren en visualiseren van vochtige lucht.

Psychrometric Chart animation

Simuleer 5 processen achter elkaar

Na het invoeren van de Luchtstartcondities, zoals de Hoogte en Luchtstroom, kun je verschillende acties uitvoeren, zoals:

 COOL

 HEAT

 MIX

 HUMIDIFY

 RECOVERY


The new condition of the air is calculated and this new point and the process will be automatically drawn in the diagram.

Chart Settings

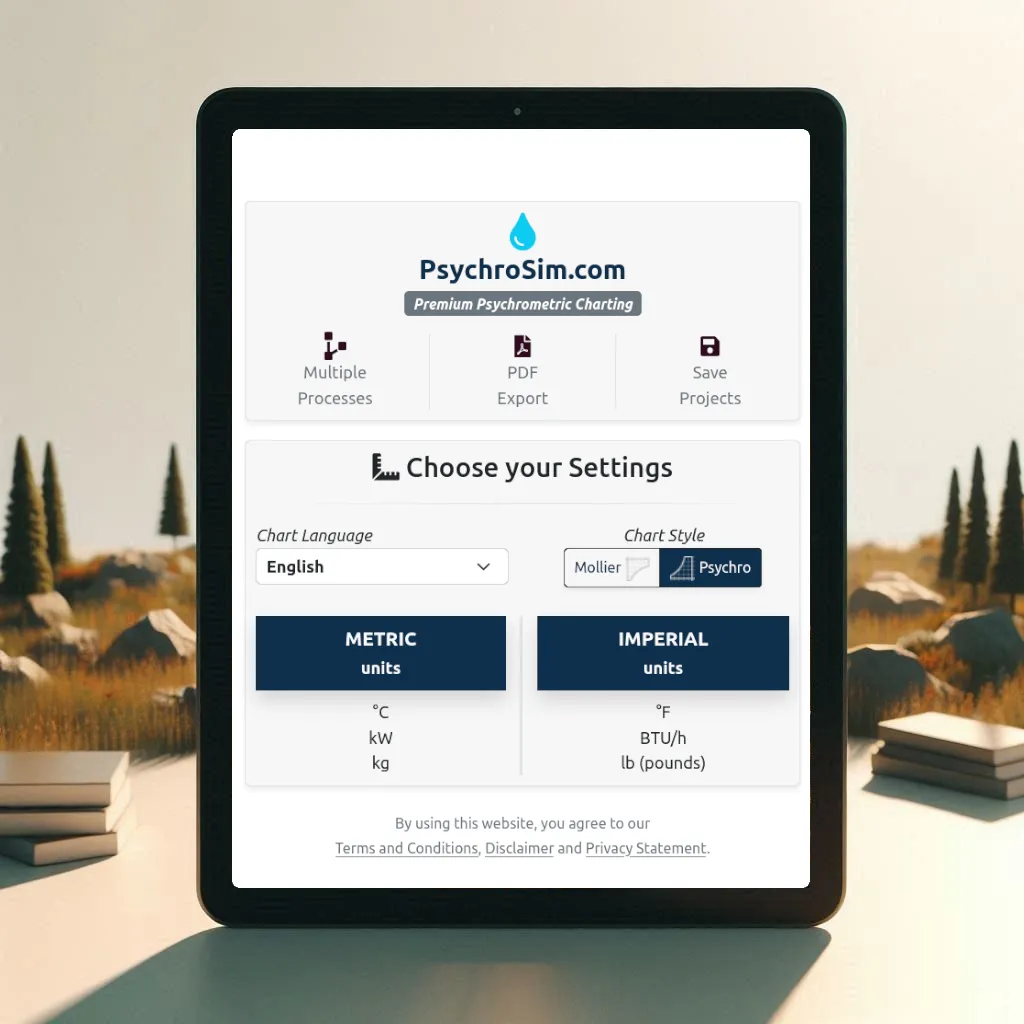
Upon accessing the tool, you will have the opportunity to set your general settings. Choose your preferred chart style and language, and select the unit system that you are familiar with.
  • Chart Style: Mollier/ Psychrometric-Chart. The x/y-axes will be flipped.
  • Chart Language: Input and output fields will be translated to your selected language.
  • Units-system: Metric(SI) or Imperial(I-P). This affects the chart, input and calculated values.

In the chart settings (icon under the chart), you can adjust the Temperature Axis and Humidity Ratio Axis, enable and set your Comfort Area and define the Air Density.

  • Axes: By adjusting the ranges, you can focus on just a part of the diagram.
  • Comfort Area: This is the range of the desired Temperature and Humidity. On/Off or customizable.
  • Density is standard set to actual Density (dynamic value). If enabled, the calculator will use the uniform density you set (fixed value).
Psychrometric Chart Settings
Find Air Condition

Finding Air Conditions

It is possible to find the air condition based on the intersection between two of these parameters types:
  • Dry Bulb Temperature
  • Wet Bulb Temperature
  • Dew Point Temperature
  • Humidity Ratio
  • Relative Humidity
  • Enthalpy

Calculated results

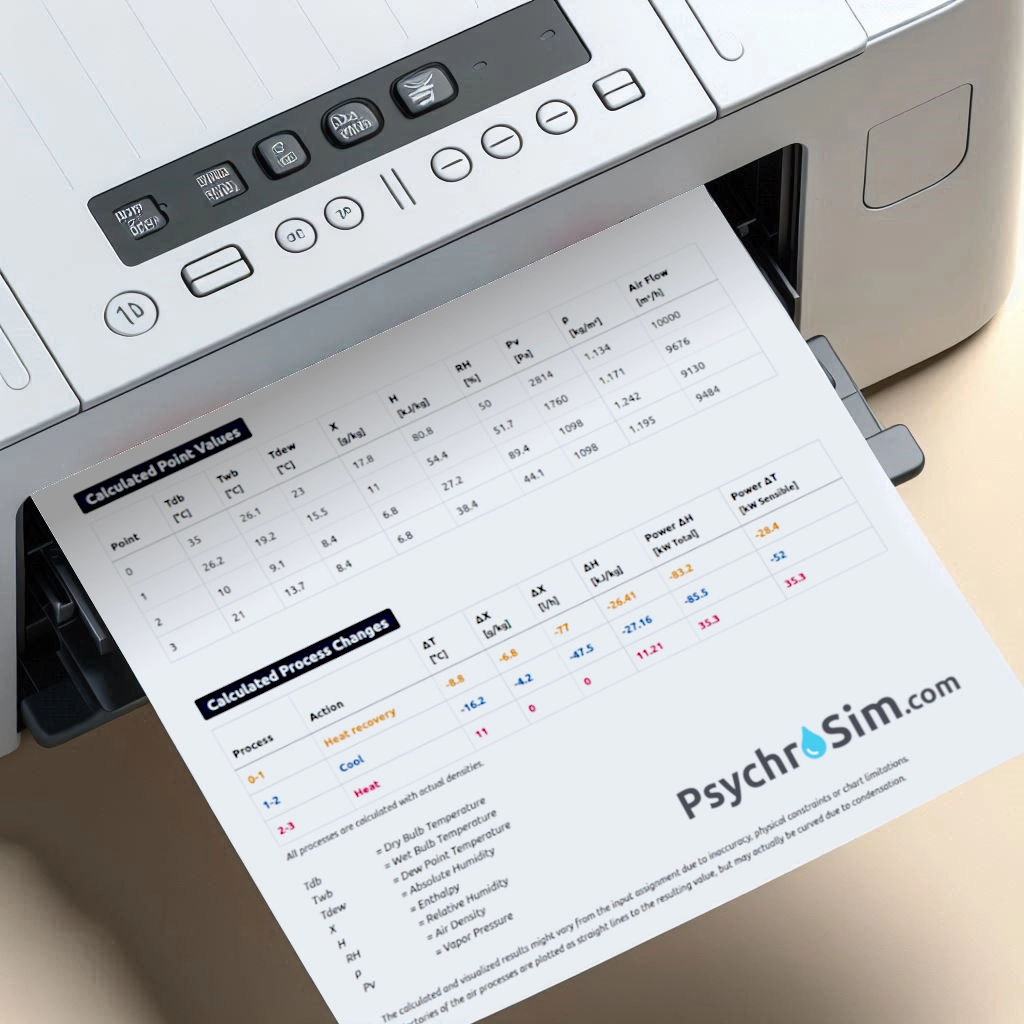
Results are plotted in the chart, but also as numbers in tables. Two tables are under the chart:

  • Calculated Point Values: All psychrometric properties of the plotted air conditions.
  • Calculated Process Changes: All psychrometric process changes between the points.

Users with the "Complete Plan", can save up to 15 Projects and the chart, input fields and the results can be downloaded as an PDF-export as well.

Download Example PDF Export
Save and Export Results


 START   Psychrometric Chart

Pricing